Our Teaching Astronomy by Doing Astronomy blog now has a new look and style to keep delivering you quality content on astronomy pedagogy and course tips.
recent posts
- Hello, World!
- At Play in the Classroom for Thirty-Five Years: Recollections and Recommendations for Keeping Our Spirits—and Our Students—Soaring
- Reaching every student in your General Education class
- Classroom Stories: Teaching Astronomy to Primarily Non-science Students in Group-setting Activities, by Sandi Brenner (Bryant University)
- JWST Carina Nebula
about
-

-
Scott Hildreth is Professor of Astronomy and Physics at Chabot College, retiring from the full-time faculty next spring after 35 years. He’s worked with NASA on numerous projects, from writing about the first images taken by the Hubble Space Telescope in 1990, to analyzing the latest pictures from the James Webb Space Telescope. He worked on NASA’s SOFIA, the Stratospheric Observatory for infrared Astronomy, an amazing 747 equipped with a 100″ Infrared telescope in its fuselage that helped to discover water on the moon.

Retirement is looming. Each day ticking by comes with a thought that I might not ever give that specific lecture again, and with a nagging feeling that I still—after more than 30 years—didn’t perfectly nail it. And with that thought, each day ahead becomes even more important, bringing butterflies to my stomach, and questions like: What can I do differently this time? What can I do to really make an impact, to help make the next class even more effective?
And writing this, a similar question arises: What could I say to you all about teaching that would be relevant and helpful? Ultimately, teaching is such a personal thing, even if our curriculum is the same. Our institutions are different, our classes are different in size and shape and time and location, our students are different, and, most of all, each of us is different in how we teach and what we want to emphasize. What could I possibly share with you from my experiences that might be useful?
I think Pablo Neruda had the best response: “Every day you play with the light of the universe.” And that’s the key. Play. Have fun. Find a way, every day, to enjoy and treasure what we do. Thinking back, where I’ve had the most fun in my classroom career comes in three “flavors.”
First, in creating assignments that generate enthused participation by transforming our students into teachers. My favorite astronomy homework involves giving students surveys and quizzes to take home, where they know the answers but must query their willing (and sometimes unwilling) participants first and then explain the correct answers. Capturing what they did, what resources they used, and whether they were successful is where they gain credit. And astronomy gives us a universe of questions that are perfect for this kind of assignment, including asking why seasons occur, and whether people think Earth is hotter in summer because it is closer to the Sun (it isn’t—it’s farthest on July 4th!), or what zodiac sign was really behind the Sun on the day they were born (spoiler alert: it probably isn’t the one they read in the newspaper!), or why astronauts in orbit are really falling, even if they look like they are floating (be prepared for most folks to say, “Oh, that’s because there is no gravity in space . . .”).
These participation assignments are enormously fun. Even after 30+ years, having students tell me how they struggled to explain why their Sun signs are different to their significant other, or how gravity really works to their grandmother, is often hilarious to read, and makes grading 40+ papers much more tolerable. Students like knowing the answers, like being the “expert,” like being able to share something with family that they have learned. Many share that the assignments gave them a reason to talk with a faraway family member. By becoming the teacher, they must learn the material at a deeper level. My meta-goal is met, and I’m smiling as wide as the moon while entering grades into my Canvas gradebook.
My second flavor of fun comes from changing the mindset of students about who does science. This is done by emphasizing the many accomplishments of women and groups currently underrepresented in STEM, and in academia in general. I start both my astronomy and my physics classes by asking students to picture scientists in those fields—to describe who they “see,” what characteristics those imagined people might have, and where those images might have been fostered. Invariably, students have pictured berobed, bearded Europeans peering through telescopes or more than slightly quirky Caucasians in white lab coats, mostly men, often reflecting wonderful characters like that of Christopher Lloyd’s Doc Brown from Back to the Future or Bill Nye “The Science Guy.” For my engineering physics students, Einstein was always a popular choice, and a few students might have heard of Richard Feynman. Still, most don’t picture women as scientists; although, that is changing positively. When I started teaching, women were perhaps 10 percent of the PhDs and faculty in STEM, and today those numbers are higher: 40 percent of STEM PhD’s and 30 percent of faculty are women (Nina Gray, Inside Higher Ed, June 13, 2023).
After that initial assignment at the start of the term to picture a scientist, I start off subsequent classes with a quick portrait of someone else doing astronomy or physics or engineering. It is great fun to see the students begin to change their own perspective about who does science. Sharing a photo, a biographical sketch, a quote, or a YouTube video takes a few minutes from each class—precious time, to be sure. But after seeing people who look like themselves, students do seem to pick up on what unites us as scientists—focusing on being curious about how the world works, being creative with experiments to explore that world, being patient and careful and persistent—rather than focusing on what on the surface might seem to be different. When I have surveyed my students about what they liked the most from my classes, invariably they share their pride in knowing of so many people contributing to science from around the globe, and especially of people who look like themselves.
My third flavor of fun comes from intentionally giving students a chance to play in class by challenging them to work together toward a common goal. I create an assignment in an online quiz tool and give it a 10- or 15-minute time limit before deploying it to the class. They must then work in groups around a single shared computer to finish. Only one student logs in for the team, and only one answer comes from the team, so they have to agree before the enter key is pressed. Teams race the clock—and each other—to finish with the highest score. I have fun acting as a play-by-play announcer relating their progress in real time. But far, far better is seeing and hearing how students react to the challenge, with loud shouts of glee when the right answer is selected, and audible groans when they are wrong. Students who know the right answer will teach their teammates. Students who are unsure will argue about physics or science. Quiet students who might not say much at all during regular lectures come out of their shells when the competition starts. The classroom is noisy, turbulent, and full of smiles. I marvel at seeing an entire class actively learning and having fun while they do it. We’ve seen in recent literature how including “gaming” can increase student engagement, and I can attest to its value.
Whatever subject we teach, however we teach, wherever we teach, don’t doubt we are making a positive difference in the world. We plant these seeds of learning in our students’ minds but don’t always get a chance to see how those sprout and grow and blossom (especially at the community college level, where students are gone or transfer in a year or two). We must have faith that those seeds, properly planted and watered and bathed in the light of learning, will sprout, one day down the road, whether we are there to see it or not. I hope to see some of that growth in my class, but even if I don’t, I have faith the students will leave knowing more about how their world works, and how much fun it is learning about that world.
(If readers would like to see some of the assignments mentioned above, or get more details, please feel free to email Scott at shildreth@chabotcollege.edu)
-
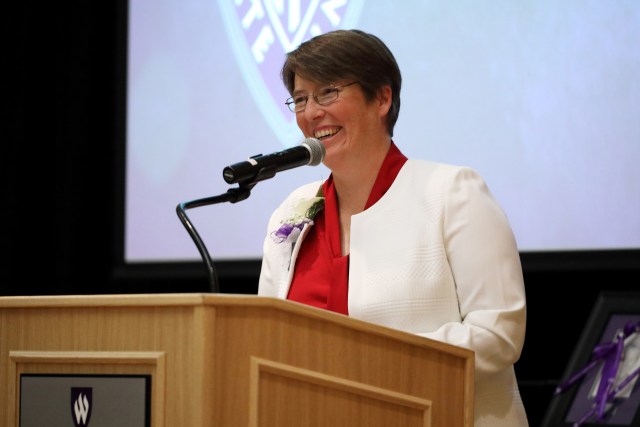
Stacy Palen
Image Credit: Zac WilliamsI know just how difficult it can be to stand in front of a large classroom of diverse students — most there just to fulfill a credit requirement—and wonder how you will facilitate their learning. My college, Weber State University in Utah, is an open enrollment institution that provides accessible educational opportunities and high-quality degrees to the students seeking them. What that means for my classroom is that I usually have students at all different levels of experience and all kinds of backgrounds.
As an author on W. W. Norton’s astronomy textbooks Understanding Our Universe, 21st Century Astronomy, and Learning Astronomy by Doing Astronomy, I’ve been intentional about bringing flexible materials to the book and resource packages that will serve all types of learners. In the book franchise and in my own classroom, I strive to engage and reach every student.
When I teach, I’ve adopted a multimodal approach that comes from observing how students learn the content and recognizing the attitudes and skills we want them to carry away from general education classes. One of the most important observations that I’ve made is that different students learn different material differently.
For example, you can have any two students sitting next to each other; one of them might learn best just by reading, and the other might learn the very same material better by doing something or carrying out an experiment. Conversely, the first student might need to learn a different subject by experimenting while the second student might need to learn it by reading. This is not, in my experience, an issue about coherent learning styles. It’s not that some students learn by seeing and some students learn by doing. It’s usually a matter of experience or background in related topics.
Because my students come from such a wide range of backgrounds and levels, what resonates most with them will vary, whether it’s seeing, hearing, reading, doing, moving their bodies, or touching. There is no accurate way to predict what instructional method will work best — it just depends on where they are in their education and what they already know when they walk in the door. With this in mind, I’ve tried to incorporate as many different types of teaching approaches as possible into my classroom and homework materials. These are carried into the books and resources that I publish for astronomy, but the idea can be carried into other general education courses, too.
This idea of including many different instructional methods may be overwhelming for some instructors, but the point is not to use every method every single time, instead you mix and match methods for the students who are sitting in front of you. This means being dynamic and flexible in response to the unique makeup of your class from semester to semester.
For example, when astronomy instructors are teaching about center of mass, students might get a lecture where they are likely to see and hear about center of mass. From there, they might get a chance to DO something — perhaps a hands-on activity from a workbook or engaging with a simulation. Maybe they will access a video or interactive online. In this phase, it is likely that they will ask a lot of “what if” questions. From there, they might use an online homework system (like Norton’s Smartwork) that has consistent vocabulary and visualizations from the textbook related to center of mass to strengthen their problem-solving and critical thinking skills. They could do some scenario solving, where they try to extrapolate what kinds of systems they are looking at from different kinds of graphs.
I will also present my students with metaphors from daily life so that they can get a clearer idea about what’s going on — even if they don’t fully understand it — in the context of what they already understand. In this example for center of mass, I’ll show a picture of a young girl being spun around by her father who is holding her hands and, thus, lifting her feet off the ground. I’ll then take my students outside and have them hold hands and spin around. In this real-life mini experiment, they can imagine what it would be like if one of them was much smaller. Soon enough, they’re applying what they’ve learned about center of mass and internalizing what it means in the context of astronomy.
The point is not just that they correctly answer the question about center of mass and pass the class. The point is that they understand how astronomy (or whatever subject you’re teaching) relates to their lives and gives them an appreciation for the discipline that they might have otherwise skipped. In my opinion, the only way to accomplish that is by using as many different approaches as possible. The lecture-study-test model that dominated education for so many years leaves many students behind, lacking in confidence, and struggling to retain important information. The only way to truly reach every student is to teach the information in a way that they can understand.
-Stacy Palen
-
I teach an Introductory Astronomy course at Bryant University – a small university with a total undergraduate enrollment of a little over 3,000 students. Although Bryant University has a College of Arts & Sciences (which included only one ‘Department of Science’,) and now a School of Health and Behavioral Sciences, it is well known for its College of Business. This is where most of my students come from. In my class, I try to not only teach them all about our amazing universe, but also ‘how’ we know all of this. Sometimes the ‘how’ is mathematical and sometimes it isn’t. I’ve also run into semesters where we get so far behind (a semester when we seemed to have a class-canceling snowstorm every week or many tech issues during COVID), that covering the entire syllabus was very challenging. So, over the years of teaching, I have developed a number of in-class group activities (“In-class Homework”) that help in my mission.
When I started these activities, some of them were begun in class, but had an ‘out of the class’ component. Unfortunately, group dynamics don’t always work well, and a number of students had trouble meeting with their group outside of class, resulting in reduced grades. These were in the days before zoom, so to solve this, all activities are now only in the classroom. Fortunately, my class meets for 1¼ hours, so there is time for the activities and then (sometimes) time left over to return to the class lecture. Mathematically speaking, I am dealing with a math-challenged group. Ask them to calculate, for example interest, they can do it in their sleep, but the minute I ask them to calculate circular velocity, they look at me like I have two heads. These are smart students, but many of them tell me “I don’t understand science.” Hence my challenge!
I cover Kepler’s Laws and Newton’s Laws early in the semester. To show the importance of math in astronomy and spaceflight, I developed a multi-part group activity where the premise is that the group is the first manned mission to Mars. Think The Martian but with no infrastructure on the planet. In part 1, I have the students calculate the spacecraft’s orbital period and semi-major axis using Kepler’s Laws, as well as the round-trip travel time needed for a simple conversation between astronauts on Mars and mission control on Earth. In part 2, they calculate first the escape speed needed to leave Earth’s orbit, then the speed of Mars in its orbit. The students work in groups, but each student submits their calculations for grading. I do walk around the room to help the students as needed (and often a lot is needed, including how to use the calculator to complete the calculations.) At the end of the ‘part 2’ activity I show them the clip from The Martian where Rich Purnell explains his proposal to the group (my favorite scene of the movie – ‘the math checks out’.)
I also have several non-mathematical activities that I’ve used, including one that helps the students to learn about the “how we know what we know” and one that is perfect for the “uh-oh I’m out of time, what do I do” moment near the end of the semester. I look forward to discussing my activities with you in an upcoming coffee break! I would love to hear your thoughts about class activities as well. The coffee break will be held Thursday, December 1, 2022, at 3pm EST. You can sign up to join us here. If you are reading this after the fact, you can get a link to the recording by reaching out to astronomy@wwnorton.com. Don’t forget to bring your favorite afternoon beverage and I look forward to seeing you on December 1st!
-Sandi Brenner, Bryant University
-

The Carina Nebula is a nearby (about 7,600 ly away) star-forming region, and this image captures just a segment of it. Above the image (out of frame) are a number of hot, young stars, producing outflows that are blowing around the dust and gas, carving out a cavity. This image captures the edge of that cavity, at the boundary between the thick dust and the partially-evacuated region.
I particularly like to point out “fingers” in the dust, which so nicely show which way the stellar winds are blowing. These fingers are dust shadows behind denser regions from which stars can form.
NBC News put together a particularly nice comparison of this image with the same image taken by HST (https://www.nbcnews.com/data-graphics/compare-photos-nasas-james-webb-space-telescope-hubble-space-telescope-rcna37875). By moving the slider back and forth, you can see how the infrared observatory sees through the dust to the underlying (newly-forming!) stars. More detail is evident in the JWST image as well, due to Webb’s increased aperture. It’s a beautiful example of how observations from telescopes operating at different wavelengths can complement each other. While the registration of the two images is not exactly perfect, it’s close enough to compare subtle details between the two images. One not-so-subtle detail jumps out that could be used to spark class discussion: near the center of the JWST image is a bright yellow star with prominent diffraction spikes. Slide the slider across to see it in the HST image, and you’ll know if your students are paying attention or not…
Supporting material in the texts and online: This image provides a great opportunity to talk to students about why astronomers use telescopes that observe at different wavelengths to explore different parts of the universe. You might reference this image in the chapters on Telescopes, Star Formation, or the Interstellar Medium. Other connected material appears in:
Process of Science Assignment: Interpreting Radiation through ISM
Astronomy in Action Video: Emission and Absorption
Learning Astronomy by Doing Astronomy Workbook, Activity 22: The Stuff Between the Stars will help students interpret what they see in this image, while Activity 7: Light and Spectra will help them understand the pairing of telescope and target, and why this region is a good target for JWST
-

The Southern Ring Nebula is a striking example of a bipolar planetary nebula, seen very nearly along the axis. Planetary nebulae result from the death of low-mass stars, and their shaping mechanisms have long been somewhat mysterious. In this image from JWST, a binary system is visible at the center of the nebula, which may provide the shaping mechanism for this object. Comparison with the HST image show that the binary star at the center was invisible before JWST took this image.
Most of the carbon in their bodies once passed through a planetary nebula like this one, as the carbon was lost from the star that fused it. Later, that carbon wound up in the cloud from which our solar system formed, so these objects have a personal relevance to our own existence.
The colors in the JWST image are not “true-color”, and this is perhaps a good image to show to initiate that conversation–why do astronomers make the color choices they do, and do the colors actually mean anything at all? (Sometimes it’s just because the person making the image liked those colors…but yes, the colors still have meaning.)
Supporting material in the texts and online: This image provides a great opportunity to talk to students about why astronomers use telescopes that observe at different wavelengths to explore different parts of the universe. You might reference this image in the chapters on Telescopes, or the Interstellar Medium. Other connected material appears in:
Exploration: Evolution of Low-Mass Stars
Process of Science Assignment: Low mass life cycle
Interactive Simulations: H-R Diagram
Astrotours: H-R Diagram
Learning Astronomy by Doing Astronomy Workbook, Activity 21: Understanding the Evolution of the Sun explores the life and death of low-mass stars.
-

I freely admit that my mind is blown any time anyone presents any data that shows anything definite about the atmospheres of exoplanets. I (wrongly) predicted that we would not see this in my lifetime, and I could not be more delighted to be wrong.
The first JWST exoplanet spectrum came in the original release of five images, and identified water in the atmosphere of WASP-96 b. This is a hot gas giant orbiting a Sun-like star more than 1,000 ly away. The spectrum is a transmission spectrum: the planet was observed as it transited the star, and then the spectrum was compared to that of the star when the planet is not in view. The spectrum has a wide range of wavelengths, and multiple water lines are present across the full spectrum. I see other narrower lines there as well that I’m certain are being investigated further.
But already, we have more! In August, a similar transmission spectrum for WASP-39 b was released, (https://www.nasa.gov/feature/goddard/2022/nasa-s-webb-detects-carbon-dioxide-in-exoplanet-atmosphere) showing a clear detection of carbon dioxide in the atmosphere of that hot gas giant.

All that said, it’s a bit of a heavy lift to help students understand how exciting a graph can be! They’ll need you to help them understand why they should be astonished that we can determine the composition of the atmosphere of a planet (even a Jupiter-sized one) from 1,000 light years away.
Supporting material in the texts and online: This image ties in to a deep fascination about life in the universe—if we are all honest about it, we are anxiously awaiting the first detection of O2. You might reference this image in the chapters on the Formation of Stars and Planets, the Giant Planets, Exoplanets or Life in the Universe.
Exploration: Exploring Exoplanets
Process of Science Assignment: Light and Spectroscopy
Interactive Simulations: Planetary Orbits Simulator and Habitable Zone
Astrotours: Atmospheres: Formation and Escape
Astronomy in Action videos: Emission and Absorption
Learning Astronomy by Doing Astronomy Workbook, Activity 6: Extraterrestrial Tourism explores the relationship between observations and properties of planets; Activity 35: Finding Habitable Worlds beyond Earth will help students understand why we are interested in the orbital properties of planets.
-

Stephan’s Quintet is most famous for its appearance in It’s a Wonderful Life, and I really enjoy privately mulling over the absolutely astonishing improvements in imaging, physical understanding, and even humility that have occurred between the time when the image appeared in the film and the time when this JWST image was taken. However, I am not so foolish as to think that students yet enjoy that type of perspective. So, I share it with you but stick to the astronomy with my students!
Four of the large galaxies in this image are close together in space, but the leftmost one is in the foreground by about 250 million light years. The others are all about 290 million light years away. The interaction between the top three galaxies that are near to one another is extraordinary. Bright red star-forming regions really pop out in this image, as do the jets emitted from the AGN in the top galaxy. There’s a nice tidal tail to the left of that topmost galaxy, and the merging galaxies right below that topmost one really give a sense of motion and inspiral.
The background to the quintet is also interesting, with lots of galaxies of various colors, sizes and shapes.
Supporting material in the texts and online: This image provides a great opportunity to talk to students about “What an Astronomer Sees”–how astronomers draw meaning out of an image by closely examining shapes, colors and relationships. You might reference this image in the chapters on the Formation and Evolution of Structure, because it so clearly shows that galaxies merge and evolve. Other connected material appears in:
Exploration: Galaxy Classification, where this image could be substituted for the image shown. Students can zoom in and identify galaxies of each type on a printout or grid.
AstroTour: Active Galactic Nuclei, which relates to the AGN in the top galaxy.
Astronomy in Action Video: Size of Active Galactic Nuclei and Galaxy Shapes and Orientation.
Hubble Law, where the connection between redshift and distance (of galaxies in the background, for example) is made concrete.
The Learning Astronomy by Doing Astronomy Workbook, Activity 28: Light Travel Time and the Size of a Quasar can help students understand why they can’t actually SEE the AGN at the bottom of the jets in the topmost galaxy.
-

Deep field images never disappoint, do they? For the novice astronomer, however, these images need quite a lot of interpretation. I usually start by identifying different types of objects in the image, and help students figure out how to identify them. The spikey objects are stars (objects like our Sun) in the foreground. These stars are bright enough that the bits of light deflected by the telescope itself are noticeable. (This is a gloss on diffraction, of course, but it’s enough for early in the semester!) A student might notice that the diffraction spikes.
The smaller, fainter objects are nearly all galaxies. This gives me the opportunity to mention what a galaxy actually is: a conglomeration of billions or trillions of stars, plus dust and gas. I’ll ask them to estimate the number of galaxies in this image, and accept any number that is in the thousands. So then I ask them to think about how many STARS are represented in this image—including the stars in the galaxies!
Next, I’ll point out that galaxies come in several shapes. I’ll point out a nice face-on spiral (there is a particularly nice one just above center on the right), and then an edge-on spiral (there are lots!). Then I’ll point out a smudgy elliptical galaxy, like the one near the center of the image.
I’ll mention that those are the two basic shapes of isolated galaxies, and then I’ll draw students’ attention to the gravitationally-lensed galaxies that appear as arcs along concentric circles around the big elliptical near the center of the image.
I’ll often ask students to notice the colors of the galaxies. At the beginning of the course, it’s too much to ask them to understand WHY more distant galaxies are redder, in general. But I ask them to notice that the galaxies shown have colors, and that distance is one of the things we can figure out from those colors.
Finally, I circle back to the most accessible big WOW of these kinds of images: a feel for the size of the universe. The image took 12.5 hours to build from lots of shorter images, and “zooms in” on a section of sky as small as a grain of sand held at arm’s length. In order to get a sense of the scale of the universe, students must imagine wallpapering the sky with grains of sand…and then replacing every single grain with an image like this one, including its thousands of galaxies.
Supporting material in the texts and online: This image provides a great opportunity to talk to students about “What an Astronomer Sees”–how astronomers draw meaning out of an image by closely examining shapes, colors, and relationships. You might reference this image in Chapter 1, as a final “zoom out” from the Figures that develop the universal address. Other connected material appears in:
The Light and Telescopes chapter, where diffraction makes an appearance (these are particularly beautiful diffraction spikes, if you are into that sort of thing!).
Evolution of High-Mass Stars, where it first becomes possible to discuss gravitational lensing.
Hubble Law, where the connection between redshift and distance is made concrete.
Formation and Evolution of Structure, which connects this image to the larger mission of JWST to find the first stars and galaxies, and finally answer these questions about how the universe has changed since very early times.
The Learning Astronomy by Doing Astronomy Workbook, Activity 32: Hubble Deep Field North is a great activity for introducing the ideas that could be explored by astronomers in the newer James Webb image.
Two related Astronomy in Action videos: Galaxy Shapes and Orientation and Expanding Balloon Universe.
-
We are so lucky to have a spiffy new telescope that has captured the public imagination over the summer!
I used the first group of five images (one is really a spectrum, but for simplicity, I’ll refer to them all as images here!) to introduce the course to my Astro101 students this semester, and it was a hit! Many of them had heard about the images over the summer, and a few had seen them. But most of them, while they might have understood a particular image, hadn’t put the grouping together to ‘see the bigger picture’, which is that these five images span the history of the universe from shortly after it began to now.
I presented them in this order:
SMACS 0723 (the Webb Deep Field) I used this image to introduce the concept of the Universe as a whole object of a certain age, which has an observable size limited by that age. I introduced a number of questions that I know my students would have, and promised to answer them once they’ve learned a few more things along the way…
Stephan’s Quintet This visual grouping of five galaxies includes a number of the signatures of interactions between galaxies, such as starburst regions and tidal tails. It’s a handy image to show to introduce the idea that the universe is not static, that even galaxies evolve over time.
Carina Nebula A nearby star-forming region starts to bring the discussion closer to home in both space and time. I’m often bemused to find that student do not know that stars are not eternal. This is a great image to show to talk about how stars form, and how we build that story from pictures like these.
Southern Ring Nebula Stars are “born”, and they also “die”. When they die, they enrich the galaxy with the elements that form new stars, new planets, and sometimes people.
WASP-96 b I found a nice segue from the Southern Ring Nebula (all about elements in the galaxy) to detecting those elements using a spectrum like this one! Later in the course, they will find out more about how to read such an image, but for now it’s enough to be absolutely staggered that it’s possible to know that there is water in the atmosphere of a planet that orbits another star!
I’ll give a bit more information and background on these images in the next few blog posts, but presenting them on Day One, as a sort of “movie trailer” for the course turned out to be a great way to inspire students to ask questions, get talking, and be motivated to continue on.
I finished with a sketching activity which I have picked up and modified from a workshop I attended years ago. I show the students the image, and then have them sketch it 3 times: once in 15 seconds, once in 30 seconds, and once in three minutes. By the third time they sketch the object, they are beginning to see things that they didn’t see in the first few seconds. This emphasizes that sometimes they just need to slow down to understand or appreciate the material—a lesson I am always trying to teach!
